
Why good businesses run short of cash
Imagine ABC Co with a full order book. Sales are rising, but the CFO can’t sleep—vendors are uneasy, and the bank balance looks thin. The problem isn’t profit; it’s timing. Cash is parked in slow‑moving stock, invoices stuck in approval loops, and payables cleared too early. Working capital optimisation is the discipline of getting that cash moving—without straining relationships or breaking compliance.
In 2025 India, the craft sits on digital rails {e‑invoicing, UPI, TReDS (i.e. Trade receivable discounting system)} and within constraints (GST workflows, MSME timelines). This article takes you from concepts to actions—with formulas, stories, and a clean diagram.
Quick Summary
- Working capital is cash trapped in operations; optimisation—not maximisation—is the goal.
- CCC = DIO + DSO − DPO; lower is better (some retail formats can be ~0/negative).
- Indicative CCC (India 2025): FMCG 20–40; Manufacturing 40–70; Renewables/Infra 70–120; IT/Services 20–50.
- Liquidity targets: Current Ratio 1.2–2.0; Quick Ratio 0.8–1.2.
- Efficiency targets vary by sector: inventory 8–12× (FMCG), 4–6× (manufacturing); receivables 10–15× / 6–10× / 3–6×; payables 8–12× / 6–8× / 4–6×.
- India nuance: respect MSME payment timelines while optimising DPO.
- Cash math: each 1 day of DSO ≈ Daily Sales; each 1 day of DIO or DPO ≈ Daily COGS.
- Case: ABC Co and EcoSolar show how tightening DSO/DIO and extending DPO unlock ₹‑crore cash while keeping trust intact.
- Cadence beats heroics: daily cash huddle, weekly WC review, monthly steering.
What exactly is working capital?
Working capital is the cash tied up in day‑to‑day operations. It equals what you expect to turn into cash within a year (cash, receivables, inventory) minus what you must pay within a year (payables, short‑term debt, accrued expenses).
• Formula: WC = Current Assets − Current Liabilities
Optimise WC to be fit‑for‑purpose for your sector, seasonality, and bargaining power—not simply maximised.
Types of working capital
Permanent (Core) vs Temporary (Variable)
Permanent WC is the baseline you need even off‑season; Temporary WC is the extra you need for peaks and growth spurts.
Positive vs Negative
Positive WC (assets > liabilities) is common in manufacturing; negative WC can work in fast‑cash retail where customers prepay and suppliers are paid later.
Regular vs Reserve
Regular WC is funded by operations and lines; Reserve WC is your contingency (reserves/standby lines) for delays and shocks.
What actually drives your working capital need
1) Nature of business & cycle length
Manufacturing/projects carry raw materials and WIP over longer cycles; services carry little inventory but face collection timing.
2) Credit terms on both sides
Generous customer credit raises receivables; longer supplier credit lowers WC. Balance both with relationship health and compliance.
3) Seasonality & growth
Peaks require temporary builds. Rapid growth amplifies all WC components—plan financing and buffers, don’t hope.
4) Process quality & technology
Clean contracts, error‑free e‑invoices, PoD/acceptance, and automated matching reduce disputes and days outstanding.
5) Financing access & cost
Committed lines reduce the need for large cash cushions; high rates push faster cycles and discount capture.
6) Regulation & the real world
MSME timelines, GST processes, subsidy cycles, inflation, and logistics all show up in WC. Build them into plans, not footnotes.
The operating cycle and the CCC (the ‘speedometer’)
The operating cycle traces cash through buy → make → sell → collect. The Cash Conversion Cycle (CCC) turns that into a single speedometer: how many days till the cash you spent returns. Lower is better; some retail formats run near zero or negative CCC.
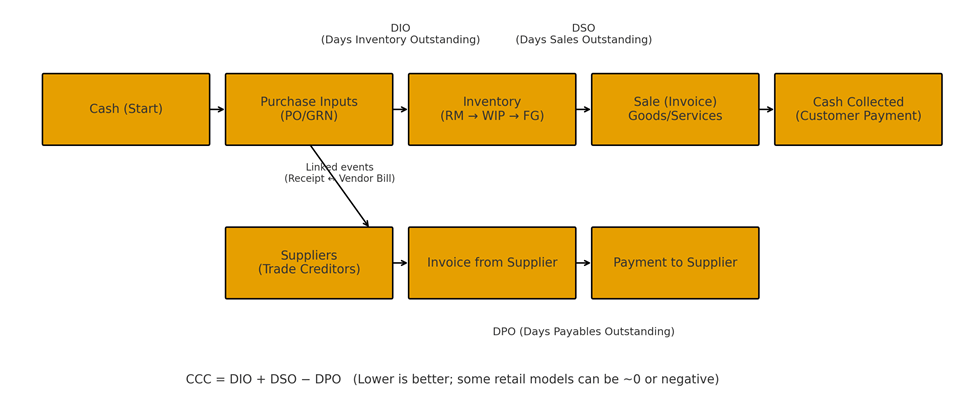
Formula — Operating cycle & Cash Conversion Cycle (CCC)
CCC = DIO + DSO − DPO
Days Inventory Outstanding (DIO) = (Average Inventory ÷ COGS) × 365 OR DIO = Average Inventory ÷ Average Daily COGS)
DSO = (Average Receivables ÷ Net Credit Sales) × 365 (alt. DSO = Average Receivables ÷ Average Daily Credit Sales)
DPO = (Average Payables ÷ COGS) × 365 (alt. DPO = Average Payables ÷ Average Daily COGS)
Use averages = (Opening + Closing) ÷ 2. Some teams use 360 days; be consistent.
*Ranges are indicative and vary by business model, bargaining power, seasonality, and MSME/legal constraints—calibrate by segment. *
Key Ratios
There are a few key ratio which is helpful in assessing and managing the effectiveness of working capital management which is as follows.
Current ratio
Current ratio is the key ratio to measure the liquidity status of the company and helps to “assess where company will be able to meet it short-term obligation or not out of its existing current assets”.
In other words, current ratio gives the answer to question where can we meet near‑term obligation out of existing current assets? It Compares what you can convert to cash soon with what you must pay soon. Many companies target 1.2–2.0 which is ideal range broadly.
• Formula: Current Ratio = Current Assets ÷ Current Liabilities
Lower can work if forecasting is tight and lines are committed; unusually high often means cash is trapped in stock/receivables.
How to improve: trim slow inventory, invoice cleanly, and refinance purely seasonal spikes into revolving lines.
Quick ratio:
Quick ratio is the same test as current ratio do but does not include inventory. It is the stricter or conservative assessment of company’s immediate liquidity position and only focus on current assets which can be readily converted into the cash. The Inventory is not a highly liquid asset since it may not be easily converted into cash within a shorter period since its conversion cycle is generally high.
Asks, “If sales paused for a few weeks, could we still meet dues?” A practical band is 0.8–1.2; slightly below 1.0 can work in fast‑cash models.
• Formula: Quick Ratio = (Current Assets − Inventory) ÷ Current Liabilities
How to improve: fix invoicing/acceptance errors; use TReDS/factoring to turn invoices into cash sooner.

Inventory turnover & DIO: do we carry the right stock?
Inventory turnover says how many times a year you sell through average stock; DIO is the day’s version.
• Inventory Turnover = COGS ÷ Average Inventory
• DIO ≈ 365 ÷ Inventory Turnover (equivalent to DIO = (Average Inventory ÷ COGS) × 365)
Typical range: FMCG 8–12× (~30–45 days); manufacturing 4–6× (~61–91); project‑heavy 2–4× (~91–183).
How to improve: ABC/XYZ focus; safety stock from variability; vendor collaboration/VMI; clean slow/obsolete stock.
Receivables turnover & DSO: how fast do invoices become cash?
It shows how often you collect the average book; DSO shows collection days.
• Receivables Turnover = Net Credit Sales ÷ Average Receivables
• DSO ≈ 365 ÷ Receivables Turnover (equivalent to DSO = (Average Receivables ÷ Net Credit Sales) × 365)
Indicative: FMCG 10–15× (~24–36 days); manufacturing 6–10× (~37–61); infrastructure 3–6× (~61–122).
How to improve: clean contracts, correct GST details, PoD/acceptance, automated reminders; consider TReDS/factoring where timing is slow.
Payables turnover & DPO: can we stretch without breaking trust?
DPO shows how long you take to pay. A higher DPO conserves cash but must respect supplier health and law.
• Payables Turnover = COGS ÷ Average Payables
• DPO ≈ 365 ÷ Payables Turnover (equivalent to DPO = (Average Payables ÷ COGS) × 365)
Where, COGS(Cost of Goods Sold) = Opening Inventory + Purchase – Closing Inventory
Note: MSME suppliers must be paid within statutory timelines; set DPO targets by vendor type and criticality.
How to improve: tier suppliers, negotiate fit‑for‑purpose terms, use supply‑chain finance/dynamic discounting so vendors can get early cash if they want.
Working capital turnover & WC‑to‑sales: are we using cash efficiently?
WCT tells you how much revenue you earn per rupee tied up; WC‑to‑sales is the percent of sales supported by WC.
• Working Capital Turnover (WCT) = Net Sales ÷ Average Working Capital
• Working Capital to Sales = Working Capital ÷ Net Sales
Typical: WCT 5–10×; WC‑to‑sales 5–15% for manufacturing/distribution; services often <5%. If outside, probe processes—not just sales.
Turnover ↔ Days cheat‑sheet (intuition builder)
Days ≈ 365 ÷ Turnover | Turnover ≈ 365 ÷ Days
12× ≈ 30.4 days • 10× ≈ 36.5 • 8× ≈ 45.6 • 6× ≈ 60.8 • 4× ≈ 91.3 • 3× ≈ 121.7 • 45 days ≈ 8.1× • 30 days ≈ 12.2×
From metric to move: a practical playbook
1) Inventory: start where value is concentrated
Sort SKUs by value & stability (ABC/XYZ). For A/X items, compute safety stock from variability; for C/Z, simplify (caps or make‑to‑order). Clean slow movers monthly.
Pro tip: Each 1 day of DIO ≈ Daily COGS. Size the prize before you act.
2) Receivables: invoice once, collect once
Prevent defects: ‘no clean PO, no ship’; same‑day e‑invoice; defects dashboard with owners and 24‑hour fixes. Automate reminders—friendly before due, firm after.
Pro tip: Each 1 day of DSO ≈ Daily Sales. Quantify and prioritise.
3) Payables: be fair, be predictable
Segment suppliers by criticality/MSME status. Lock predictable payment runs. Capture early‑pay discounts only if annualised return > WACC; otherwise use full terms. Offer supply‑chain finance.
4) Cash forecasting & governance: rhythm beats heroics
Run rolling 13‑week and 12‑month forecasts. Define buffers & breach actions. Hold a daily cash huddle and a weekly WC review; small gains compound.
Example: ABC Co’s 90‑day working‑capital tune‑up (Illustrative)
Quarter 1 opens with friction. Customer receipts arrive 15–20 days late; plant managers over‑order to ‘be safe’; vendors complain about unpredictable payments. The CFO sets three rules: (1) invoice once—no defects, (2) stock math beats gut feel, and (3) pay predictably, not randomly.
Baseline (averages, ₹ crore): Net Credit Sales 1,095; COGS 730; Receivables 135; Inventory 90; Payables 60; Cash 40; Short‑term Investments 20; Other Current Liabilities 95.
Key ratios at start:
• Current Ratio ≈ 1.90 (CA 295 ÷ CL 155) – liquid but hiding slow AR/stock.
• Quick Ratio ≈ 1.32 — okay, but receivables quality varies by customer.
• Inventory Turnover ≈ 8.11× ⇒ DIO ≈ 45 days — acceptable, with pockets of over‑stock.
• Receivables Turnover ≈ 8.11× ⇒ DSO ≈ 45 days — invoices often bounce for basic errors.
• Payables Turnover ≈ 12.17× ⇒ DPO ≈ 30 days — vendors are paid early/late with no pattern.
Moves (Weeks 1–4): sales ops enforce ‘no clean PO, no ship’; e‑invoices on the same day; a defects dashboard lists owner, root cause, and 24‑hour fix time. Supply chain re‑labels SKUs with ABC/XYZ and recalculates safety stock for A/X items. Treasury fixes Tue/Fri pay runs and offers supply‑chain finance to Tier‑A vendors; MSME invoices get priority within statutory timelines.
Moves (Weeks 5–8): customer portals go live; automated reminders start; disputes older than 7 days escalate to a named exec. Stock clean‑down begins for slow movers. Commercial negotiates DPO to 45–50 days with non‑MSME, non‑critical suppliers.
Outcome (Week 12): Suppose after all the corrective step, DSO improves by ~8 days; DPO extends by ~12–15 days; DIO trims by ~4–6 days on A/X SKUs. Cash impact using our case base: each DSO Day ≈ ₹3.00 crore; each DIO or DPO day ≈ ₹2.00 crore. Even a conservative shift (DSO −8, DPO +12, DIO −4) unlock cash of ≈ (8×₹3) + (12×₹2) + (4×₹2) = ₹24 + ₹24 + ₹8 = ₹56 crore without new debt.
More importantly, the team now runs on rhythm: a 15‑minute daily cash huddle, a weekly WC review, and a monthly steering where outliers are celebrated or fixed. Trust rises—customers get cleaner invoices, vendors get predictable cash, and managers see stock levels they can defend.
Another Example: EcoSolar India Ltd (Illustrative)
Suppose Current: DIO 61, DSO 61, DPO 49 → CCC = 73 days. Sales ₹1,200 crore; COGS ₹900 crore → Daily Sales ≈ ₹3.288 cr; Daily COGS ≈ ₹2.466 cr.
Improve: DSO 61→45 (−16) and DPO 49→65 (+16). Cash ≈ 16×3.288 + 16×2.466 ≈ ₹92.06 crore; New CCC = 41 days with improved DSO and DPO.
Further: DIO −4 days adds ≈ 4×2.466 ≈ ₹9.86 crore → total ≈ ₹102 crore.
Sector snapshots (Illustrative target)
FMCG: CCC 20–40 days. Retail: often zero/negative CCC (customer cash upfront). Manufacturing: CCC 40–70 days. Renewables/Infra: CCC 70–120 days (use financing tools). IT/Services: near‑zero inventory; DSO dominates.
Challenges in 2025 (what to watch)
Receivable norms at 90–120 days in some segments; SME leverage limits on DPO; volatile input prices; evolving tax/reporting demanding ERP discipline.
30/60/90‑day starter plan
0–30: Freeze definitions of DIO/DSO/DPO; daily cash huddle; invoice hygiene and defects dashboard.
31–60: Segment customers for terms; portals/automated reminders live; recalibrate safety stock for A/X SKUs.
61–90: Pilot supply‑chain finance; expand inventory clean‑downs; publish a weekly CCC dashboard with owners and due dates.
Conclusion: Make cash a weekly habit
Working capital isn’t an abstract finance metric; it’s the tempo of your business. When you teach teams to read DIO, DSO, and DPO—and you give them ownership and a weekly cadence—cash starts to breathe again. The playbook is simple: invoice cleanly, stock scientifically, pay predictably, and forecast with discipline. Do this for 90 days and you will feel the difference—in vendor trust, customer satisfaction, and the cash you must fund growth.
FAQ
Q1) What is working capital and how to calculate it?
A: Working capital is cash tied up in day-to-day operations. Formula: Working Capital = Current Assets − Current Liabilities.
Q2) What is the Cash Conversion Cycle (CCC)?
A: CCC is the “cash speedometer” showing how fast cash returns to you: CCC = DIO + DSO − DPO. Lower CCC means faster cash.
Q3) How do I compute DIO, DSO, and DPO?
DIO = (Average Inventory ÷ COGS) × 365
DSO = (Average Receivables ÷ Net Credit Sales) × 365
DPO = (Average Payables ÷ COGS) × 365
Use averages: (Opening + Closing) ÷ 2.
Q4) What’s a good CCC in India (2025)?
A: Indicative ranges: FMCG 20–40 days; Manufacturing 40–70; Renewables/Infra 70–120; IT/Services 20–50. Calibrate to your model, seasonality, and bargaining power.
Q5) What are healthy liquidity ratios?
A: Broad bands many Indian firms target: Current Ratio 1.2–2.0, Quick Ratio 0.8–1.2. Outliers merit a closer look at inventory and collections.
Q6) What’s the difference between the operating cycle and CCC?
A: The operating cycle tracks buy → make → sell → collect. CCC condenses that into a single number (DIO + DSO − DPO) to show days from cash out to cash back.
Q7) Can negative working capital be good?
A: Yes—in fast-cash models (e.g., retail) where you collect from customers before paying suppliers. It’s a strategy, not a problem, if service levels and supplier trust remain strong.
Q8) How can I lower my CCC quickly?
A: Three levers: (1) DSO↓—invoice cleanly, fix defects, use reminders/TReDS/factoring; (2) DIO↓—ABC/XYZ focus, safety stock math, remove slow/obsolete stock; (3) DPO↑—tiered terms, predictable runs, supply-chain finance (respect MSME timelines).
Q9) What is TReDS and how does it help receivables?
A: TReDS (Trade Receivables Discounting System) lets MSME invoices get discounted on licensed platforms so suppliers receive early cash while buyers retain terms.
Q10) Do MSME payment timelines affect DPO?
A: Yes. For eligible MSME suppliers, pay within statutory timelines. Build MSME priority into payment runs and set different DPO targets by vendor type.
Q11) Should we use early-payment discounts?
A: Use them when the annualised return exceeds your WACC and you have liquidity. Quick rule:
Return ≈ (Discount ÷ (1−Discount)) × (365 ÷ (Net days − Discount days)).
Q12) What are typical turnover ranges (India 2025)?
A: Inventory: FMCG 8–12×; Manufacturing 4–6×; Project-heavy 2–4×.
Receivables: FMCG 10–15×; Manufacturing 6–10×; Infra 3–6×.
Payables: Retail 8–12×; Manufacturing 6–8×; Energy 4–6×. (Illustrative; benchmark your segment.)
Q13) What’s the quickest way to estimate cash impact?
A: Each 1 day of DSO ≈ Daily Sales; each 1 day of DIO/DPO ≈ Daily COGS. Example: If Daily Sales = ₹3 crore, cutting DSO by 5 days frees ≈ ₹15 crore.
Q14) Does e-invoicing/GST change working capital?
A: Yes. Clean e-invoices (IRN) reduce disputes and DSO. Thresholds for e-invoicing can change—check the current limit and ensure ERP compliance.
Q15) What’s the difference between Working Capital Turnover and WC-to-Sales?
A: WCT = Net Sales ÷ Average Working Capital (higher = better use of cash). WC-to-Sales = Working Capital ÷ Net Sales (lower % suggests leaner operations, within safe limits).
Mini Glossary
DIO — Inventory days held before sale.
DSO — Receivable days to collect after invoicing.
DPO — Payable days before paying suppliers.
CCC — DIO + DSO − DPO; lower = faster cash return.
WCT — Sales per rupee of working capital.
MSME timelines — statutory payment limits for eligible suppliers; plan DPO by vendor tier.
Related Reading
Sources & References
- Cash Conversion Cycle (CCC) formula & interpretation: CFA Institute explainer (CCC = DIO + DSO − DPO) and what it means operationally; you can also cite a practitioner guide (CFI) for a plain-English walkthrough.
- TReDS (Trade Receivables Discounting System): RBI’s official FAQ and the operative guidelines laying out how MSME invoices are financed on licensed exchanges.